 eAtlas Data Catalogue
Australian Rivers Institute, Griffith University
Type of resources
Topics
Contact for the resource
Provided by
Years
status
-
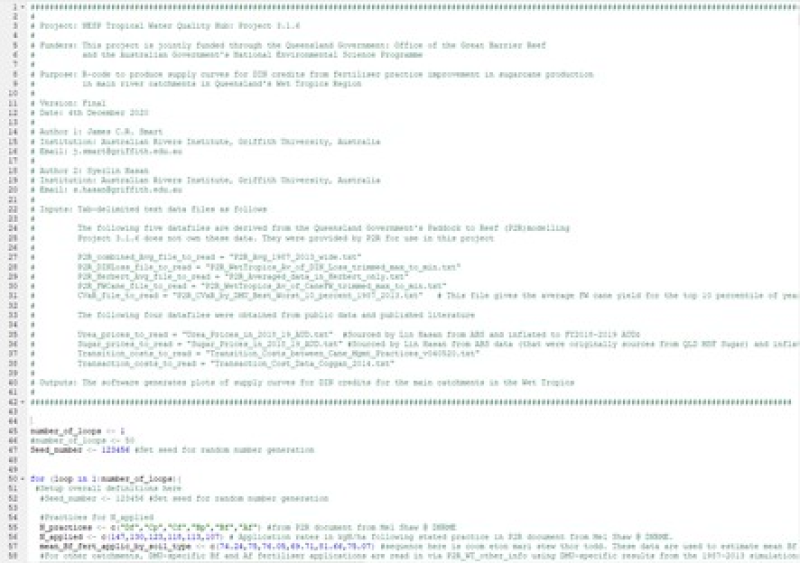
P2R.data.reader.v041220 with Header.R This is a block of R code written for NESP Tropical Water Quality Hub Project 3.1.6 The software uses data supplied from the Queensland Government’s Paddock to Reef (P2R) modelling system, and other publicly available data, to generate plots of supply curves for water quality credits in dissolved inorganic nitrogen (DIN) for the main catchments in the Wet Tropics. The aim of Project 3.1.6 was to compare the cost of supplying DIN credits from various sources with the prices that potential credit buyers would be willing to pay for those credits. This R-code estimates the minimum cost of supplying DIN credits via fertiliser practice change in sugarcane production in the main Wet Tropics catchments (Daintree, Mossman, Barron, Mulgrave-Russell, Johnstone, Tully, Murray and Herbert). Key data inputs on reductions in cane yield and reductions in DIN loss from 563 individual cane land management units[1] in the Wet Tropics are obtained from the Queensland Government’s Paddock to Reef (P2R) modelling program. Data on fertiliser cost, sugar prices, sugar content in cane, equipment cost and growers’ ‘transaction cost’ in engaging in water quality credit trading are obtained from public sources and the literature. Results are produced in the form of estimated supply curves for DIN credits from practice change in cane for the main Wet Tropics catchments. [1] The Queensland Government’s Paddock to Reef (P2R) modelling and monitoring program (The Australian and Queensland Governments, 2018) defines unique combinations of soil type, soil permeability, climate zone and sub-catchment in sugarcane land in the Wet Tropics catchments as separate cane ‘management units’. Methods: The Queensland Government’s Paddock to Reef (P2R) modelling and monitoring program (The Australian and Queensland Governments, 2018) defines unique combinations of soil type, soil permeability, climate zone and sub-catchment in sugarcane land in the Wet Tropics catchments as separate cane ‘management units’. P2R’s mapping produces 563 separate cane management units for which full cane yield and DIN loss predictions are available over the time period 1987-2013. In Project 3.1.6, the minimum cost of supplying DIN credits from practice change in cane in the Wet Tropics at management unit resolution is calculated as the sum of the following four components: 1. Opportunity cost: the reduction in average annual farm gross margin that follows from a reduction in fertiliser application rate. Average farm gross margin is derived from average P2R-simulated cane yields over the period 1987-2013 (Fraser et al., 2013). Opportunity cost is calculated on an annual basis. 2. Compensation for increased exposure to risk of reduced yield: the average reduction in farm gross margin from years containing the top 10% of P2R-simulated yields over the period 1987-2013 that follows from a reduction in fertiliser application rate (Fraser et al., 2013). Compensation for increased exposure to risk is calculated on an annual basis. 3. Transition cost: the annualised cost of equipment purchases required to implement each step improvement in fertiliser practice. Transition cost data are drawn from van Grieken et al., (2019; Table 2, p.4), inflated to 2018AUD using the Reserve Bank of Australia’s inflation calculator (https://www.rba.gov.au/calculator/ ).Transition cost is annualised over the 6-year cane cycle at a discount rate of 7% per annum, to produce an annualised equivalent transition cost that is compatible with the annual timeframe over which opportunity cost and the compensation required for increased exposure to risk are calculated. 4. Transaction cost: the annualised cost of the resources, including time, that a landholder has to commit to learn about and engage with water quality credit trading. Transaction cost data are drawn from (Coggan et al., 2014; Table 5, p.512), inflated to 2018AUD using the Reserve Bank of Australia’s inflation calculator (https://www.rba.gov.au/calculator/ ).Transaction cost is annualised over a 6-year cane cycle at a discount rate of 7% per annum to produce an annualised equivalent transition cost that is compatible with the annual timeframe over which opportunity cost and the compensation required for increased exposure to risk are calculated. Each element of cost is calculated for each step change in fertiliser management practice in line with the Sugarcane Water Quality Risk Framework 2017-2022 (The Australian and Queensland Governments, n.d.)(https://www.reefplan.qld.gov.au/__data/assets/pdf_file/0036/78867/sugarcane-water-quality-risk-framework-2017-2022.pdf ) i.e. for successive step improvements in fertiliser management practice on the Sugarcane Water Quality Risk Framework – Practice Level D to Practice Level C, Practice Level C to Practice Level B etc. Estimates of transition cost and transaction cost vary depending on the size of the farm within which a management unit is located. These data were not available to Project 3.1.6, so management units are stochastically allocated to small, medium or large farms across multiple simulation loops. Within each stochastic allocation, the total land area allocated to the different size classes of farms is matched to within 1% of that reported by Sing and Barron (2014). The initial level of fertiliser practice is also allocated stochastically across management units to match the proportion of catchment land area managed under the different levels of fertiliser practice as reported in the 2017 and 2018 Reef Report Cards (Commonwealth of Australia and Queensland Government, 2018). For each step change in fertiliser management practice on each management unit, the cost incurred (the sum of opportunity cost, compensation required for exposure to increased risk, transition cost and transaction cost) and the reduction in DIN loss achieved (at the cane field and at End-of-Catchment) are recorded. (Management unit-specific DIN transport coefficients for DIN lost via the surface water pathway are provided by P2R modelling. A uniform DIN transport coefficient from the literature is used for DIN lost via deep drainage (after Webster et al., (2012), as cited in van Grieken et al., 2019; Sec 3.3, p.4). The supply curve for supply of DIN credits from a catchment is constructed by ordering practice change steps from management units in that catchment from the most cost-effective (i.e. lowest $/kgDIN @ EoC) to the least cost-effective (i.e. highest $/kgDIN @ EoC), and then plotting cumulative DIN reduction (kgDIN reduced @ EoC) vs cost-effectiveness ($/kgDIN @ EoC). See Figure 5.5 to 5.9 in the final report ( https://nesptropical.edu.au/wp-content/uploads/2021/01/NESP-TWQ-Project-3.1.6-Final-Report.pdf ). Format: This data delivery is presented as a block of R-code. The first few lines of the tab-delimited input data files are also included in the data delivery to illustrate the format and content of the input data. Datafiles containing P2R data cannot be included in the eAtlas archive because Project 3.1.6 does not hold the rights to these data. Data Dictionary: Data delivery comprises: R-code to generate DIN credit supply curves, plus input data files R-code file: P2R.data.reader.v041220 with Header.R Input data files: as tab-delimited text files Data from Paddock to Reef (P2R): file header only included P2R_combined_Avg_file_to_read = "P2R_Avg_1987_2013_wide.txt" P2R_DINLoss_file_to_read = "P2R_WetTropics_Av_of_DIN_Loss_trimmed_max_to_min.txt" P2R_Herbert_Avg_file_to_read = "P2R_Averaged_data_in_Herbert_only.txt" P2R_FWCane_file_to_read = "P2R_WetTropics_Av_of_CaneFW_trimmed_max_to_min.txt" CVaR_file_to_read = "P2R_CVaR_by_DMU_Best_Worst_10_percent_1987_2013.txt" Publicly available data, compiled by NESP Project 3.1.6 Urea_prices_to_read = "Urea_Prices_in_2018_19_AUD.txt" Sugar_prices_to_read = "Sugar_Prices_in_2018_19_AUD.txt" Transition_costs_to_read = "Transition_Costs_between_Cane_Mgmt_Practices_v040520.txt" Transaction_costs_to_read = "Transaction_Cost_Data_Coggan_2014.txt" References: Coggan, A., van Grieken, M., Boullier, A., Jardi, X., 2014. Private transaction costs of participation in water quality improvement programs for Australia’s Great Barrier Reef: Extent, causes and policy implications. Aust. J. Agric. Resour. Econ. 59, 499–517. https://doi.org/10.1111/1467-8489.12077 Commonwealth of Australia and Queensland Government, 2018. Agricultural Land Management Practice Adoption Results: Reef Water Quality Report Card 2017 and 2018. Fraser, G., Shaw, M., Silburn, M., 2013. Paddock to Reef 2: Cane Paddock Scale Modelling – Wet Tropics Region. Sing, N., Barron, F., 2014. Management practice synthesis for the Wet Tropics region: A report prepared for the Wet Tropics Water Quality Improvement Plan. Terrain NRM, Innisfail. Terrain NRM, Innisfail. Queensland. The Australian and Queensland Governments, 2018. Paddock to Reef Integrated Monitoring, Modelling and Reporting Program 2017-2022: Summary. The Australian and Queensland Governments, n.d. Sugarcane water quality risk framework 2017-2022. van Grieken, M.E., Roebeling, P.C., Bohnet, I.C., Whitten, S.M., Webster, A.J., Poggio, M., Pannell, D., 2019. Adoption of agricultural management for Great Barrier Reef water quality improvement in heterogeneous farming communities. Agric. Syst. 170, 1–8. https://doi.org/10.1016/j.agsy.2018.12.003 Webster, A.J., Bartley, R., Armour, J.D., Brodie, J.E., Thorburn, P.J., 2012. Reducing dissolved inorganic nitrogen in surface runoff water from sugarcane production systems. Mar. Pollut. Bull. 65, 128–135. https://doi.org/10.1016/J.MARPOLBUL.2012.02.023 Data Location: This dataset is filed in the eAtlas enduring data repository at: data\nesp3\3.1.6_Exploring-WQ-trading\